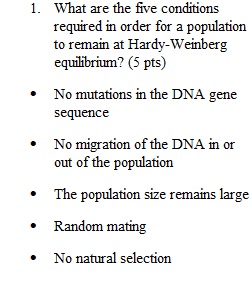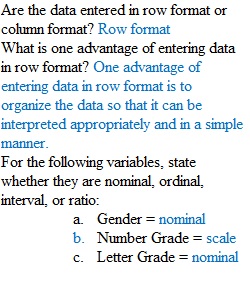
Q Name: Date: Background: You just finished teaching your first PSYCH 248 lab section, and it’s time to calculate the grades. Your wonderful teaching assistant created an Excel file with all of the students’ exam grades, homework grade, and lab grade as well as their gender. Your next steps are to calculate each student’s final grade, convert those scores to letter grades, and describe the distribution of scores. Data Management Steps: 1. Download the CA1_Dataset.csv file from Blackboard. 2. In Excel, calculate the final Number Grade, Letter Grade, and Z-score for each student. a. To calculate the Number Grade, type a numerical equation after an = sign in a cell or use the =AVERAGE() formula. Grades for this course are comprised of three parts: lecture exams (60%), homework (20%), and lab (20%). b. To convert Number Grade to Letter Grade, enter the data by hand after sorting the data from largest to smallest. For this assignment, let’s convert Number Grade into Letter Grade using the following rubric: A (90-100), B (80-89), C (70-79), D (60-69), F (<60). c. To calculate the Z-score, use the =STANDARDIZE() formula on the Number Grade variable. This formula requires three components: x (i.e., one student’s Number Grade), the sample mean, and the sample standard deviation. You can calculate the sample mean and standard deviation for Number Grade using the =AVERAGE() and =STDEV.S() formulas. i. Create a new column called Abs(Z-score). In this column, use the =ABS() formula on the Z-score variable you just created to get the absolute values of each Z-score. 3. Now that you have filled in your dataset, save your file and open it in JASP. a. In the Data View, apply value labels to the Gender variable by clicking on the title of the column and entering the following: 0=Woman, 1=Man, 2=Non-binary. b. Make sure that each variable has the correct “column type” (i.e., nominal, ordinal, or scalar). Questions (please write your answers in blue): 1. Row vs. Column a. Are the data entered in row format or column format? b. What is one advantage of entering data in row format? 2. For the following variables, state whether they are nominal, ordinal, interval, or ratio: a. Gender b. Number Grade c. Letter Grade d. Z-score 3. Frequencies a. How many women were in the class? b. Paste the frequency table that shows this data below. 4. Percentages a. Of those who reported their gender, what percentage of the class identified as non-binary? 5. Distribution Plots a. For the Number Grade variable, create a Distribution Plot and apply a density curve. Paste the graph below. b. Does this plot appear to be fairly normal, positively skewed, or negatively skewed? 6. Normality/Skewness a. What is the skewness value for the Number Grade variable? b. Does this mean the distribution of Number Grades is normal or skewed? Why? 7. Descriptive Statistics a. Give the mean, median, mode, standard deviation, minimum, and maximum for the Number Grades variable (round to two decimal places). b. Look at these same descriptive statistics for Exam 1, Exam 2, and Exam 3. On average, which exam did students score best on? 8. Descriptive Statistics by Group a. Give the mean, median, mode, and standard deviation for the Number Grades variable for each gender group separately. b. Given the distribution of the data, which measure of central tendency would be the most appropriate to report? 9. Boxplots a. Create boxplots for Number Grade separately for each gender group; make sure to label outliers. Paste your boxplots below. b. Which gender group has the least variability? How can you tell? 10. Outliers a. In the boxplot you created for the questions above, how many outliers are there? b. What do the numbers next to each outlier dot stand for? 11. Percentiles a. When looking at the whole sample, what value corresponds to the 70th percentile for the Homework variable? b. What does scoring in the 70th percentile mean? 12. Z-Scores a. How many Number Grades have an absolute Z-score of 2 or higher? b. What Letter Grade coincides with having a Z-score of -2 or lower? 13. Transforming Numerical Data to Categorical Data a. How many A’s did students receive in your class? What percentage of the class received B’s? b. Paste the frequency table you used to answer the above question below.
View Related Questions